Introduction
Figuring out what is going on within a KVM guest using a guest login is quite easy: Tools like sar as well as various tracing facilities inside the kernel are readily available to drill down into an arbitrary level of detail.However, in absence of access to the guests, things become a lot more difficult: There are no comparable tools available. And if there was, then obtaining a comparable level of details would likely be seen as a security flaw. Yet in production environments, that is what a KVM host admin is usually faced with.
But fear not: There are still ways to at least draw some conclusions towards a guest's activities by monitoring its interaction with the hardware.
However, before we can jump into details, we must check on some of the theory behind virtualization on IBM Z first, before we can move on to take a closer look at the kvm_stat utility. At the end, we will look at a use can to apply everything that we learnt.
Basics: SIE Intercepts & DIAGs
On IBM Z, the SIE instruction (START INTERPRETIVE EXECUTION) does most of the heavy lifting as far as running KVM guests is concerned. While SIE itself is opaque, the hypervisor gets back control for a number of reasons - which can be observed from within the hypervisor!Here is an overview of the most frequent reasons for interrupting SIE:
- Intercepts:
- Instruction exit, 0x04
- External request, 0x10
- I/O request, 0x18
- Wait state, 0x1c
- Partial execution, 0x38
- DIAGs:
- Release pages, 0x010
- Voluntary time-slice end, 0x044
- Voluntary time-slice yield, 0x09c
- Page-reference services, 0x258
- Time-bomb / watchdog, 0x288
- Re-IPL, 0x308
- Virtio functions, 0x500
- Guest gdb support, 0x501
Each of these intercept and DIAG types has a respective event, that can be observed using kvm_stat. Therefore, we can draw conclusions by observing frequency and kind of these events as emitted by a KVM guest. E.g. a guest triggering lots of intercepts 0x18 is obviously performing a lot of I/O. We might not be able to tell the content, but knowing that a guest is very active in terms of I/O can be a helpful clue within an investigation!
So, since the reason for interrupting SIE is transparent in the host, we can draw at least some conclusions to what the guest is currently doing.
kvm_stat Fundamentals
kvm_stat can display events from two different sources:- tracepoints, see /sys/kernel/debug/tracing. This is the default, but can still be selected using command line option -t.
- kvm in debugfs (referred to as DebugFS in this posting), see /sys/kernel/debug/kvm. To choose this source, start kvm_stat with command line option -d.
Note that kvm_stat can be started with both sources enabled at the same time, using DebugFS, we can start out with the full history by using command line parameter '-i' as in
$ kvm_stat -dt
Base Usage
Run kvm_stat -d to get a list of events sorted by number of events per second as follows:

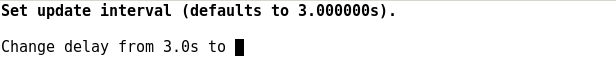
E.g. to change the refresh interval from the default length of 3 seconds, press 's' to set to a new value:
$ kvm_stat -di


- We can dynamically reset the event statistics at any given point by pressing 'r'.
- When shutting down or restarting a kvm guest, the guest's events will no longer be available to kvm_stat, and be removed from column 'Total'.
- kvm_stat offers more functionality, like logging and batch modes. However, this posting focuses on interactive use of kvm_stat only.
Event Fields Filtering And More
To get an overview of all available event fields, run kvm_stat with option -f help. E.g. list all event fields available from DebugFS:$ ./kvm_stat -df help
deliver_emergency_signal
deliver_external_call
deliver_prefix_signal
deliver_program_interruption
deliver_restart_signal
deliver_service_signal
deliver_stop_signal
deliver_virtio_interrupt
diagnose_10
diagnose_258
diagnose_308
diagnose_44
diagnose_500
diagnose_9c
exit_external_interrupt
exit_external_request
[...]
When running kvm_stat, press 'f' to enter a regular expression to focus on a specific event or a group of event fields:


To clear the fields filter, simply press 'c'.
But there is more to event fields. Use 'x' to drill down (if possible) into some of the event fields to get a more fine-grained view on the events. On IBM Z, the event exit_instruction allows for a deeper investigation, listing all of the individual instructions called within the guest that led to an exit:

Investigating Guests
A KVM host will typically run a whole number of guests at the same time. However, by default kvm_stat summarizes events across all guests.To list the events for a single guest, press 'g' and select a guest by PID or name:

Note that kvm_stat will now also list the name of the guest (here: s12sp1) along with its PID in the header:


Putting Everything Together
Here is a sample investigation to illustrate how to put everything we learnt above to good use.
In a first step, we notice a suspicious amount of exit_instruction events on our host.

Note that within the exit_instruction event, the number of DIAG 44 events sticks out, as evident by a respective drill-down using interactive command 'x'.
Next up, we focus on exit_instruction events exclusively by applying a respective fields filter.

Since we have multiple guests running on that host, we drill down into individual guests, with the fields filter still applied.

We check the respective guest:
   $ virsh dominfo rhel7
   Id:             4
   Name:           rhel7
   UUID:           12c60e6b-af18-404a-add5-adebba837aa7
   OS Type:        hvm
   State:          running
   CPU(s):         64
   CPU time:       474.1s
   Max memory:     4194304 KiB
   Used memory:    4194304 KiB
   Persistent:     yes
   Autostart:      disable
   Managed save:   no
   Security model: none
   Security DOI:   0
Sure enough, after adjusting the domain XML and rebooting the guest, things went back to normal.
Finally
- Be careful when comparing event numbers between guests running in different Linux distributions: That can make quite a difference even for guests running the same payload! This is due to kernel levels changing behavior.
- What seems normal to some, may seem abnormal to others. Therefore, always record “good” case numbers as a reference to what is "normal" for a specific guest.
- Guest starts and stops generate a huge amount of events that can push it towards the top of the list, depending upon view and length of the history. Either take into account, or reset the statistics.
No comments:
Post a Comment